Project information
- Category: Python Project
- Title: Data Visualization
- Project date: 08 April, 2023
- Project URL: Data Visualization
Description
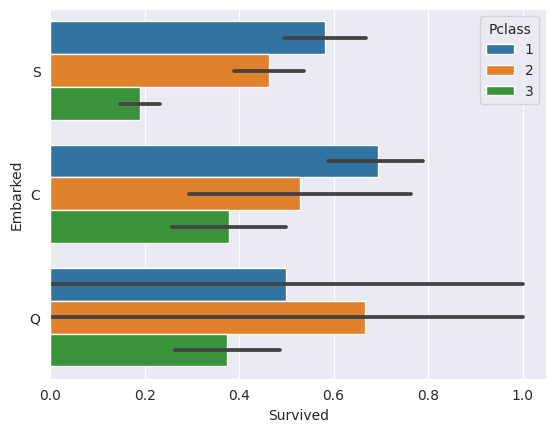
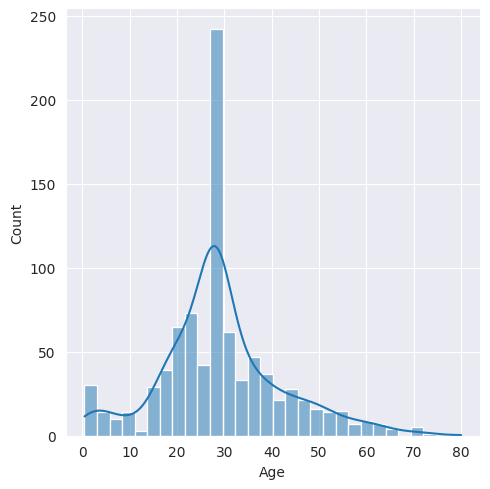
Data visualization aims to help users understand large and complex information in a more understandable and engaging way. Using ship accident data, visualization is carried out as follows:
1. barplot: plot of the number of passengers based on gender, Pclass, Embarked, and Passenger safety.
2. boxplot: distribution plot of age, number of siblings, number of families, and passenger fare.
3. Scatterplot: plot of the relationship between passenger age and fare.
4. Pie chart: number of passengers based on gender, Pclass, Embarked, and passenger safety.